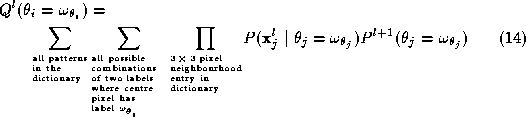
image patches where the labels of up to two different regions are
allowed to co-exist. In Figure
1
we illustrate the entries of this dictionary. Letters A and B stand for
two different region labels. Therefore, each entry of the dictionary
depicted represents as many entries as there are pair combinations of
the available region labels. For example, for 3 possible labels the
dictionary will contain
image patches where the labels of up to two different regions are
allowed to co-exist. In Figure
1
we illustrate the entries of this dictionary. Letters A and B stand for
two different region labels. Therefore, each entry of the dictionary
depicted represents as many entries as there are pair combinations of
the available region labels. For example, for 3 possible labels the
dictionary will contain possible allowable configurations.
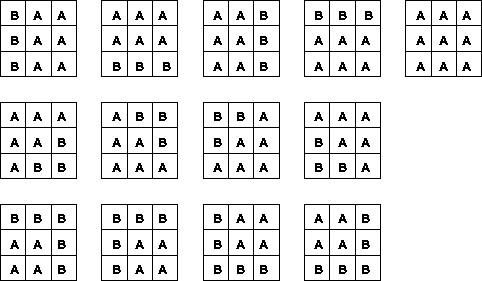
Figure 1:
Entries in pattern dictionary
Further, the expression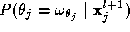 is the probability of label
 given to pixel
j
at the previous level of resolution. We can write this as
given to pixel
j
at the previous level of resolution. We can write this as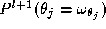 . In the absence of any prior knowledge, the prior probabilities of the
various labels can be considered as constant and omitted from
12
because they would appear in both the numerator and the denominator of
formula
13
and thus ultimately cancel. In view of the above, formula
12
simplifies to:
. In the absence of any prior knowledge, the prior probabilities of the
various labels can be considered as constant and omitted from
12
because they would appear in both the numerator and the denominator of
formula
13
and thus ultimately cancel. In view of the above, formula
12
simplifies to:
 expresses the probability of a certain measurement to arise in each
class. For example, in the problem we are applying this methodology, the
measurements we use at each level of resolution are the values of the
Luv colours of a pixel and the probability of each triplet of Luv values
to arise is computed from the colour histogram of each class. The colour
histogram of a class at resolution level
l
is created by reading the values of the pixel associated with this class
with confidence higher than
expresses the probability of a certain measurement to arise in each
class. For example, in the problem we are applying this methodology, the
measurements we use at each level of resolution are the values of the
Luv colours of a pixel and the probability of each triplet of Luv values
to arise is computed from the colour histogram of each class. The colour
histogram of a class at resolution level
l
is created by reading the values of the pixel associated with this class
with confidence higher than at level
l
+1. The various levels of resolution are created by smoothing the image
using the masks proposed by Zhang and Wandell [
14
]. These masks imitate the smoothing performed by the human vision
system when it sees colour textures from various distances. Thus, the
coarsest level we start from mimmicks the way the image would look when
viewed from several meters distance, with all colour textural detail
lost by blurring. This over-blurred image is clustered with the help of
a K-means algorithm and the process of probabilistic relaxation is
performed as we proceed towards the finer levels. We perform the
clustering and the histogramming in the
Luv
colour space since the Euclidean differences between pixels in this
space reflect their perceptual similarity. The initial probabilities are
set using the clusters in the most blurred image. They are computed as a
function of the squared distance of a pixel from the mean of each and
every cluster [
8
].
at level
l
+1. The various levels of resolution are created by smoothing the image
using the masks proposed by Zhang and Wandell [
14
]. These masks imitate the smoothing performed by the human vision
system when it sees colour textures from various distances. Thus, the
coarsest level we start from mimmicks the way the image would look when
viewed from several meters distance, with all colour textural detail
lost by blurring. This over-blurred image is clustered with the help of
a K-means algorithm and the process of probabilistic relaxation is
performed as we proceed towards the finer levels. We perform the
clustering and the histogramming in the
Luv
colour space since the Euclidean differences between pixels in this
space reflect their perceptual similarity. The initial probabilities are
set using the clusters in the most blurred image. They are computed as a
function of the squared distance of a pixel from the mean of each and
every cluster [
8
].
Figure 2 displays the results of this approach on some collages of real colour textures of ceramic tiles. For comparison, we also show the result of segmentation achieved by Matas and Kittler [ 6 ] whose method of colour segmentation groups colour pixels by taking into account simultaneously both their feature space similarity and spatial coherence. Our segmentation accuracy calculated as a percentage of correctly segmented pixels, varied between 98.3 to 99.998% and these figures were consistently better than Matas and Kittler's approach.


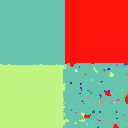


Figure 2: (left column) Original images, (middle column) Segmentation by applying Matas & Kittler's approach, and (right-column) Segmentation by multilevel probabilistic relaxation. Original images are in colour where different colours simply indicate different labels.
Dr. Majid Mirmehdi